Database Structure
Database Design With Entity-Relationship Diagram
Synopsis
Database design for a ‘Connected Health’ business strategy at an extensive pharmacy network.
Situation
Recent changes in provincial regulations in Canada enable pharmacists to provide a growing list of medical services including: vaccinations, medical reviews, and treatments for minor ailments, in addition to their traditional role as prescription dispensers. Importantly, primary pharmacy IT systems deployed in the network are decentralized (each pharmacy is an independent unit) and transactional (capturing transactions at the pharmacy and not designed for patient treatments). How may the network mine rich historical data captured in thousands of pharmacies? Can a central and patient-centric system better support the emerging roles of pharmacists? Can we support patients receiving treatment in multiple pharmacies? Can we measure the health outcomes of patients and make proper recommendations for products and services?
</div>

Architecture Solution
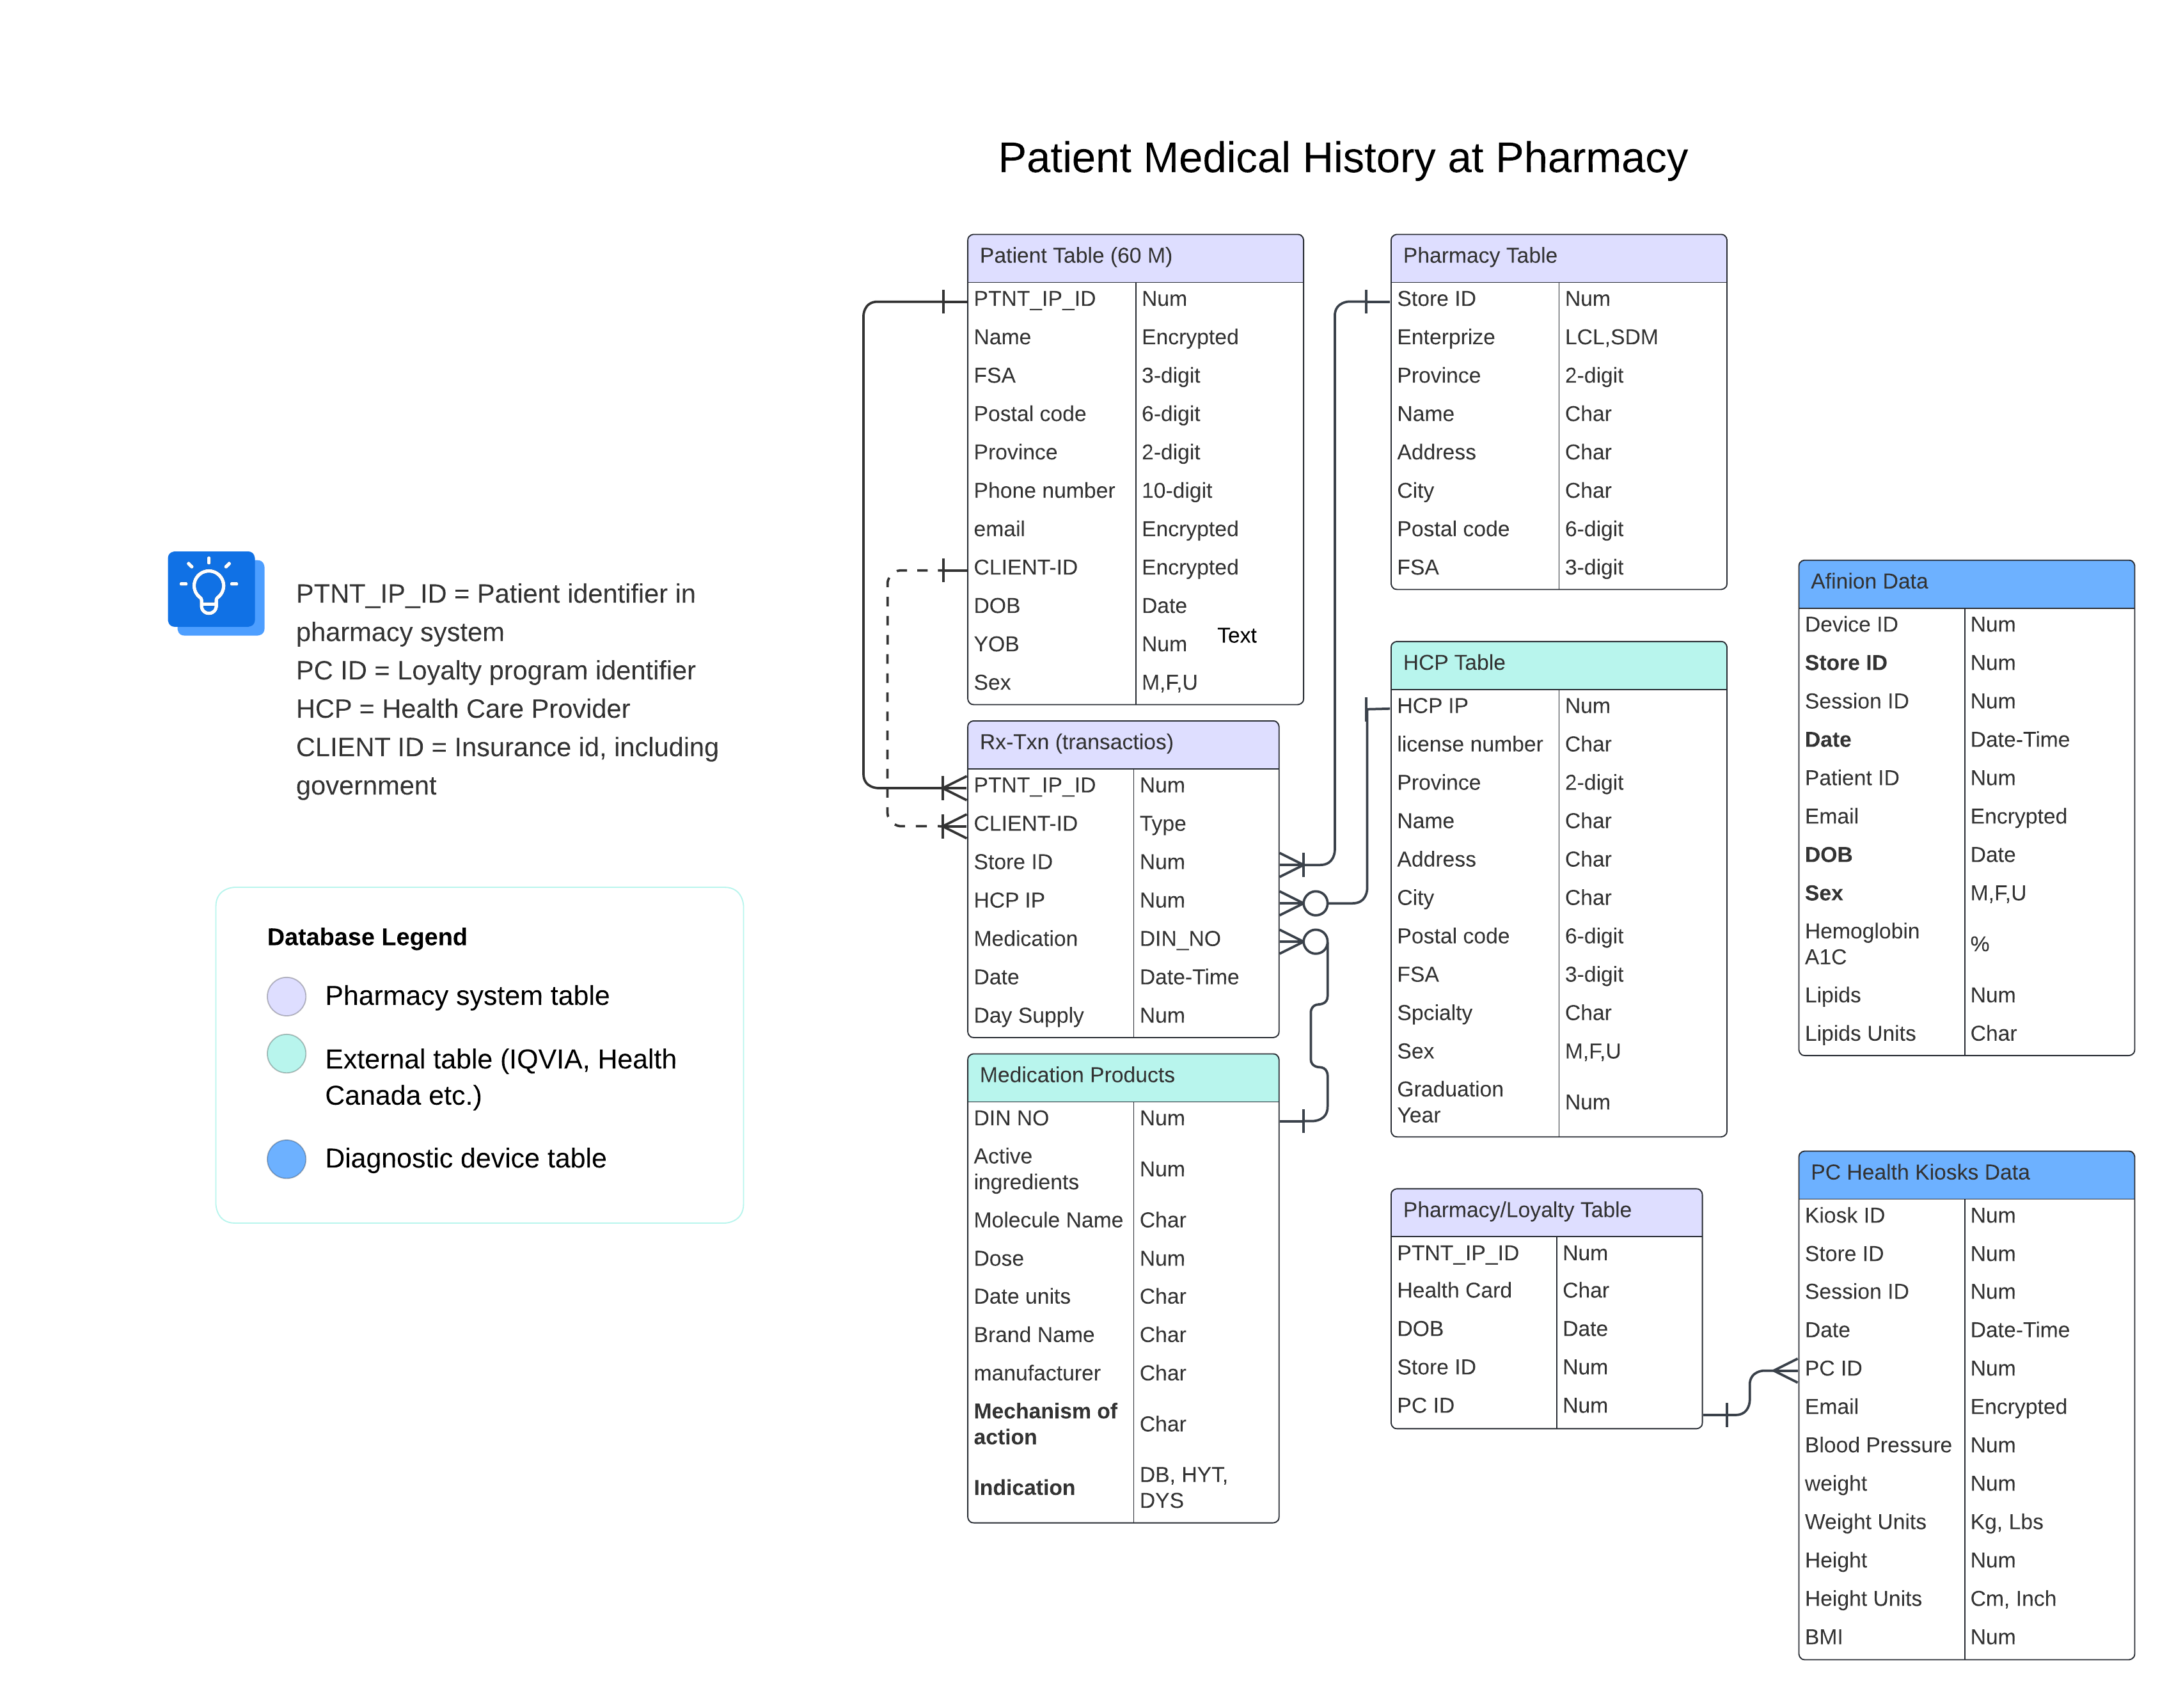
At the core, I designed three tables (as depicted above) curated from pharmacy transaction systems across Canada using an efficient and semi-automatic data pipeline (written in Python/SQL):
- Patient Table: containing all patient profiles curated from all systems (about 60 million rows).
- Store Table: containing data on all pharmacy stores (about 2,000 rows).
- Prescription transaction table: data captured by prescription dispensing (billions of rows). Services Table: Medical services provided by pharmacists. I augmented these large tables with smaller tables curated from public sources and commercial vendors in coordination with additional enterprise teams:
- Health Products Table: Health Canada published database of all pharmaceuticals approved for sale in Canada.
- Healthcare Providers Table: Sourced from medical professional colleges in each province and/or from a third-party vendor (IQVIA).
- PC Health Kiosk table: Curated by a third-party vendor from blood pressure kiosks deployed at pharmacies.
- Afinion Table: Hemoglobin A1C and Lipid values captured in pharmacies using Afinion devices and curated by a third-party vendor.
- Canadian Community Health Survey (CCHS): Sourced from Statistics Canada and includes FSA aggregated health data.
- Digital patient surveys: Monthly surveys designed to capture intentions to vaccinate or measure blood pressure and deployed by a third-party vendor.
Advantages and limitations
This architecture was a key component in adopting modern agile data science practices. Consolidated pre-cleaned tables replaced thousands of columns (many redundant or unnecessary) of ‘dirty data’ in a traditional SQL server. Sensitive data fields (such as emails and phone numbers) are encrypted for privacy compliance, and data access is strictly governed using Google’s IAM policies and service accounts. Deployment of these tables in Google’s BigQuery platform (scalable with data size) plus the adoption of virtual machines for data processing, Looker for visualizations, and code repos for code preservation enabled my team to complete analytic tasks and projects faster. For example, targeting patients eligible for vaccination services by age and chronic condition that used to run for hours and sometimes end in spooling errors are now delivered in minutes and can be automated in the visualization platform. Furthermore, tasks considered impossible, such as linking Hemoglobin A1C results with pharmaceutical records (without a unified and consistent patient identifier), became feasible with new patient identity resolution methods developed by my team.
Cloud Platform
While we implemented this architecture in the Google Cloud Platform, these tables can be transferred to other cloud providers, such as AWS or Azure. However, a cloud switch will triger significant code revisions in pipelines and downstream applications, a multi-cloud solution vendor should be considered to avoid risks from a single cloud vendor.
Interoperability
A key limitation of this data architecture is not adhering to conventional patient data standards such as HL7 FHIR (Fast Healthcare Interoperability Resources). Adopting consistent healthcare data standards at the source pharmacy systems or during data collection will improve systems interoperability and should be encouraged in future iterations.